Did you know that an estimated 30 million websites on Earth use Google Analytics? That's more than 10 times the next popular analytics tool. Suffice it to say, if you’re a small business owner or blogger, Google Analytics is a tool you should have from Day 1.

Google Analytics (GA) integrates seamlessly with other members of Google Workspace, as well as other tracking tools. Even if you’re running other analytic tools, you still need GA enabled.
Unfortunately, despite significant developments over the past decade, Google Analytics continues to have a notoriously cluttered interface – making it anywhere from finicky to frustrating to use, even for established users.
This article will walk through the most essential components of Google Analytics, and how to understand them – for 90% of people, what’s in this guide is more than enough to run your website.
There are a few things that need to be cleared up before we dive in. For starters, this guide assumes you have a basic knowledge of Google Analytics – in so much as you’ve been able to install it on your website.
Installing Google Analytics on a WordPress Site
Installing Google Analytics on a Squarespace Site
The first thing you’ll notice is that your Google Analytics dashboard has essentially 5 major browsing categories: home, customization, realtime, audience, acquisition, behavior and conversions.
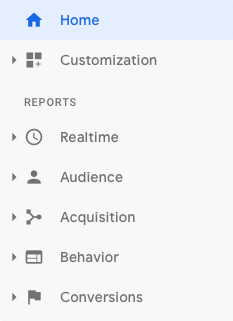
Home and customization are relatively simple. Home pulls in various data points from the 5 reports and organizes it into a simple dashboard, and customization lets you create your own dashboards organized to your liking. Pretty self-explanatory, right? For the purposes of this guide, we’ll dig into the 5 reports – first walking through the main page and concepts, then giving an overview of the other data each of those reports can expose.
Google Analytics’ Realtime reports are rather unique – they tend to attract the most attention (and are probably the first thing you clicked), yet they’re arguably the least useful of all the reports for your business.
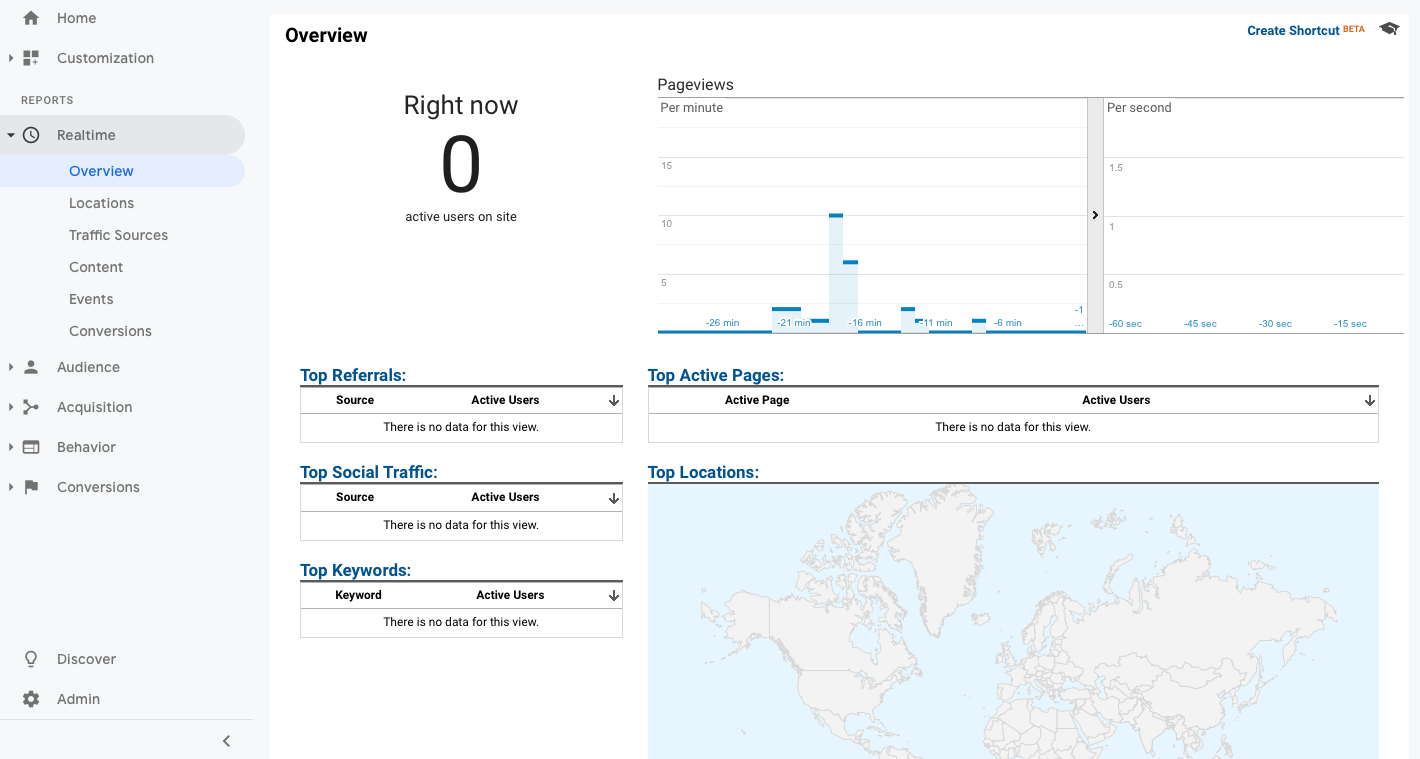
Realtime is simple: how many users are currently on your website, what are they doing there, and where they are from.
The realtime page is fun to look at, and useful to stick on a monitor to watch your website’s progress, but doesn’t give any deep insights into consumer behavior. It can be useful for monitoring product launches, debugging or simply having a growth ticker, but offers limited information beyond that.
The overview page simply tells you how many users are on your website at that moment, and where they’re coming from (both digitally and geographically). The subcategories then let you break it down, allowing you to get a granular look at the geographic makeup of current users and the specific referral sources.
The content subcategory allows you to break down current traffic by page, to see exactly what pages people are viewing currently. This is probably the most useful subcategory under realtime, because it’s useful for analyzing the draw of a traffic spike, or identify broken pages.
Events & conversions both show any events and conversions as they’re performed on your website in realtime. Do note, again, in order for these to expose any kind of data, you need to be tracking events and/or conversions.
The realtime report is the place to go to know exactly what’s happening on your website at any given moment.

Google’s Audience report is the most detailed, and by far the most useful report of the bunch – and likely the place you’ll be spending most of your time. In simple terms, the Audience report breaks down your visitor traffic in several useful ways.
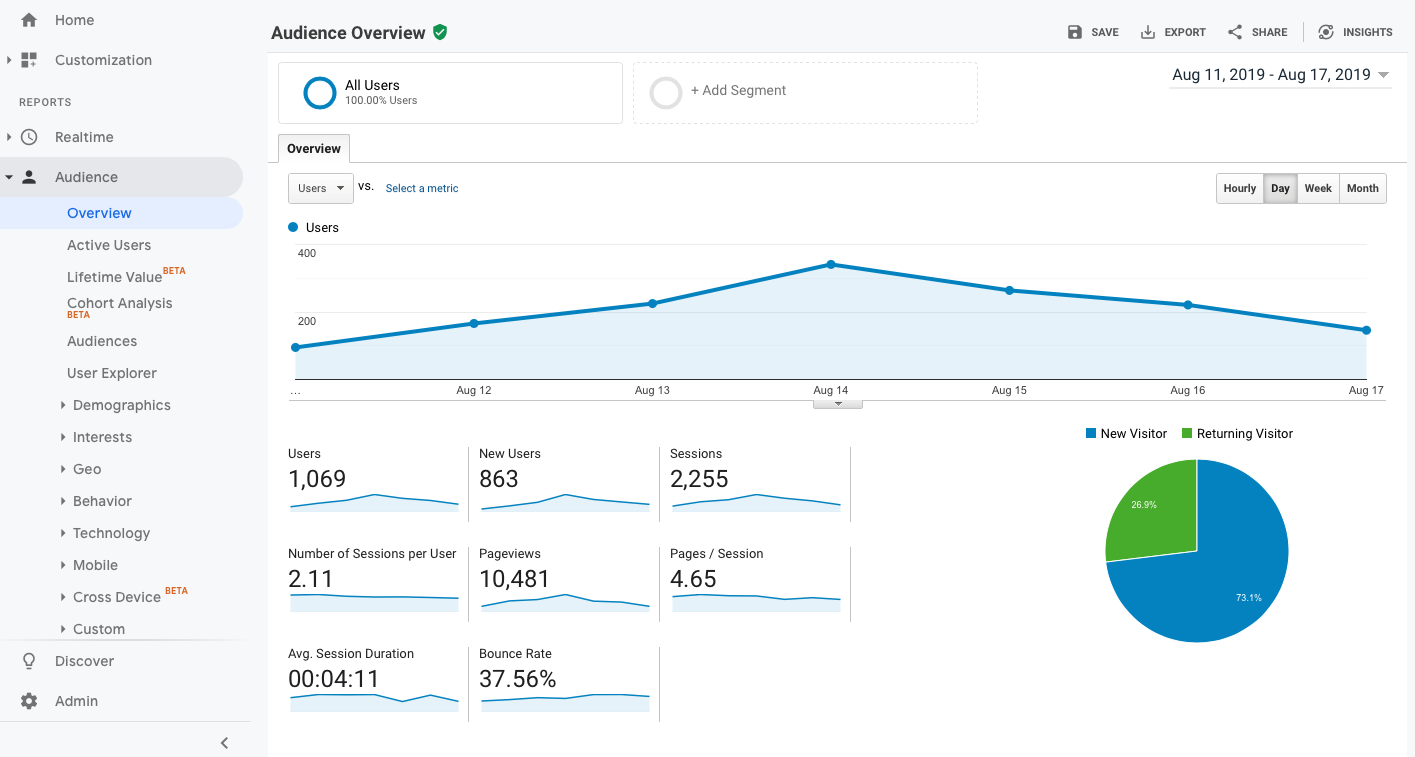
The overview page gives all of the important details. Before diving in further, we have to define a very foundational concept in Google Analytics: session vs user.
In Google Analytics, a session is a single visit from a unique user. Important to note that a single user can record multiple sessions on your website. In the above example, the website received 1,069 unique users over the date period, contributing to 2,255 sessions, leading to an average of 2.11 sessions per user. This means that the average user visited the website twice (for most websites, there’s very high variance to this number – in reality, a small number of your users will visit multiple times – most will likely just visit once).
The audience overview is useful for digging into general information about your customers – what languages do they speak, what countries they’re coming from, etc.
Audience has an immense list of subcategories that go deep – every subcategory breaks down your customers by virtually any category you can think of, from age and geography, to engagement and frequency (how often they visit).
Most of these subcategories won’t be that useful to you, and largely only relevant at extremely high traffic levels (really, things like benchmarking aren’t useful unless you have a traffic sample size in the millions). Active users is useful for visualizing how your user running activity/traffic breaks down over the past 30 days, but otherwise largely restates information you can gather in the Overview page.
The overview lets you know how many active users you have, what percentage of those are new and where they’re coming from. The last piece of the puzzle is what they’re doing there. We’ll break this down further under the “Behavior” report, but the “Users Flow” sub-category lets you visualize your entire traffic funnel over a period.
Between overview & user flow, you’ll probably get 60-70% of the information you’ll ever need in the early days.
The usefulness of the last 3 reports on the list are very situational, starting with acquisition.
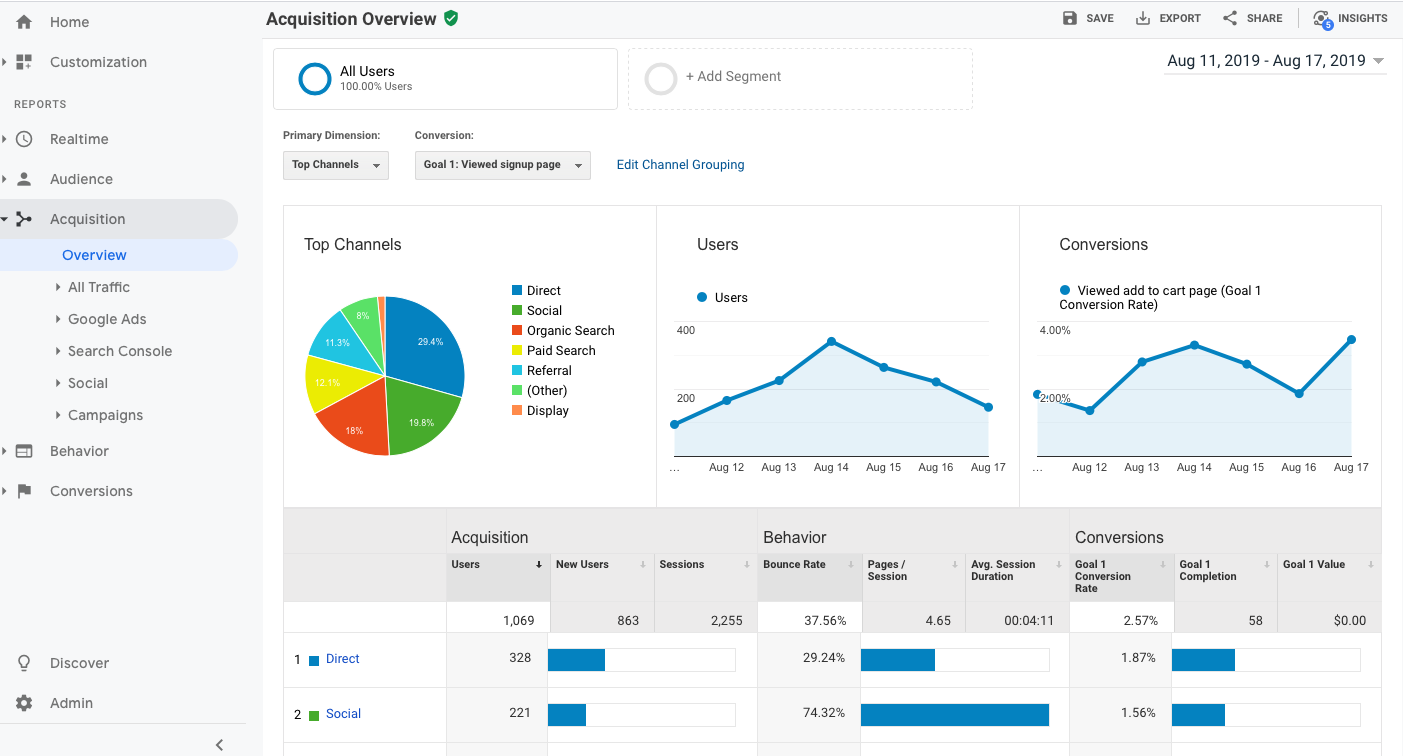
The acquisition report tells you where your users are finding your website. For most small businesses, the information given in the audience report is enough – the acquisition overview largely restates most of that (primarily, what channels do your customers come from).
However, if you’re looking to drill down into the channels, this is the place to do it. It’s most useful if you’re running multiple different marketing campaigns.
For businesses running a single campaign at a time, the audience acquisition overview is enough, but if you want to break it down into different marketing campaigns across different channels, this is the place to do it. Acquisition offers a separate individual subcategory just for Google Ads, as well as search console (which you need to enable here, if you’re doing lots of SEO work).
If you’re running marketing campaigns and want to deep dive into how well each one is doing, this is the place to do it. Do note: to get the most out of it, you should make sure to track the necessary events & conversions, because Acquisition doesn’t offer a page-by-page breakdown.
(If you need a page-by-page breakdown, you can run custom filters against the Behavior Site Content’ subcategory.)
If the Audience User Flow isn’t enough for you, and you’re looking for more granularity, the Behavior report is designed for just that, allowing you to deep-dive into what visitors to your website are doing once they get there.
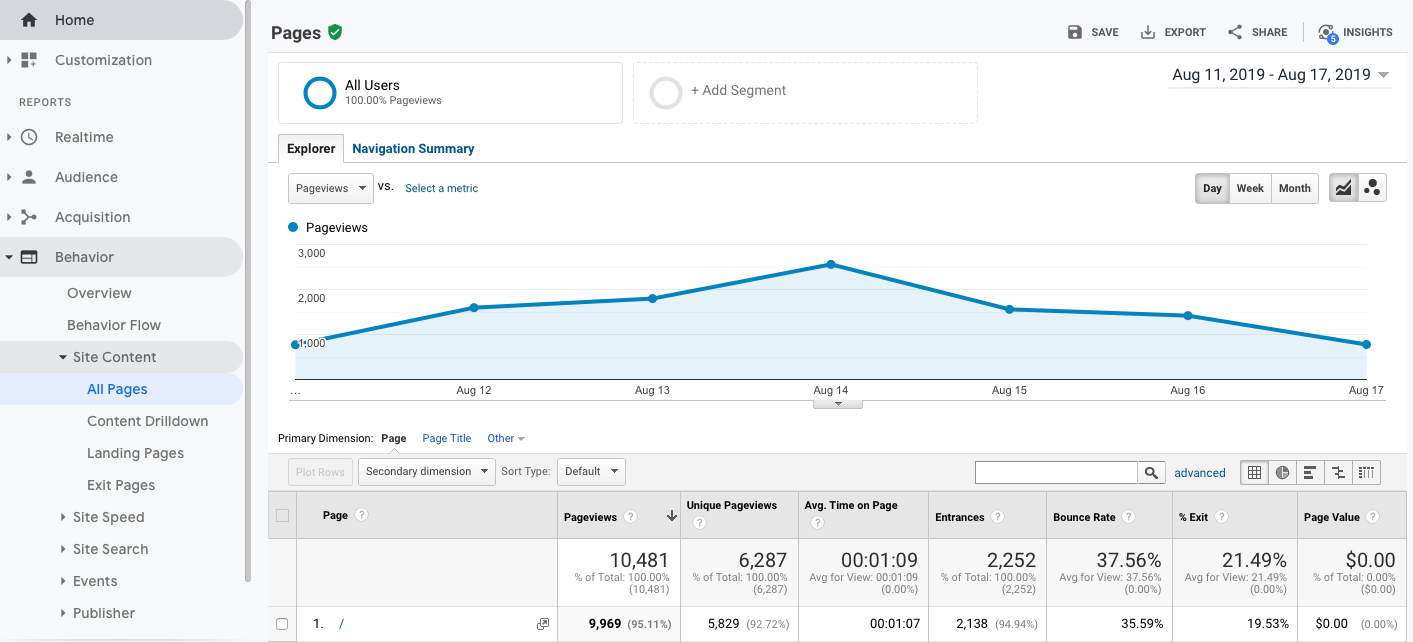
The most relevant part of Behavior is the Site Content subcategory, which lets you break down traffic across different landing pages, blog posts, etc. Exit Pages can also be a useful view – it breaks down how many people left your website (in other words, ended a session) from each page. This is useful to see what pages are scaring your customers off.
The rest of the Behavior sub-categories are only situationally useful. Site speed gives you details on your page load times. Site Search is only useful if using Google search on your website, and Publisher is only useful if you’re publishing ads from AdSense.
The last major sub-category under Behavior is Events, giving a full breakdown of the different events taking place and organizing it by page. It also features the useful “Events Flow”, which is similar to Behavior Flow, but shows the user journey broken down to an individual event level. All of these, of course, require that you have event tracking set up, which we talked about earlier.
The Conversions report is the most situationally useful one, and usually is only relevant to eCommerce companies. If you’re tracking conversion and revenue events, the Conversions report breaks those down.
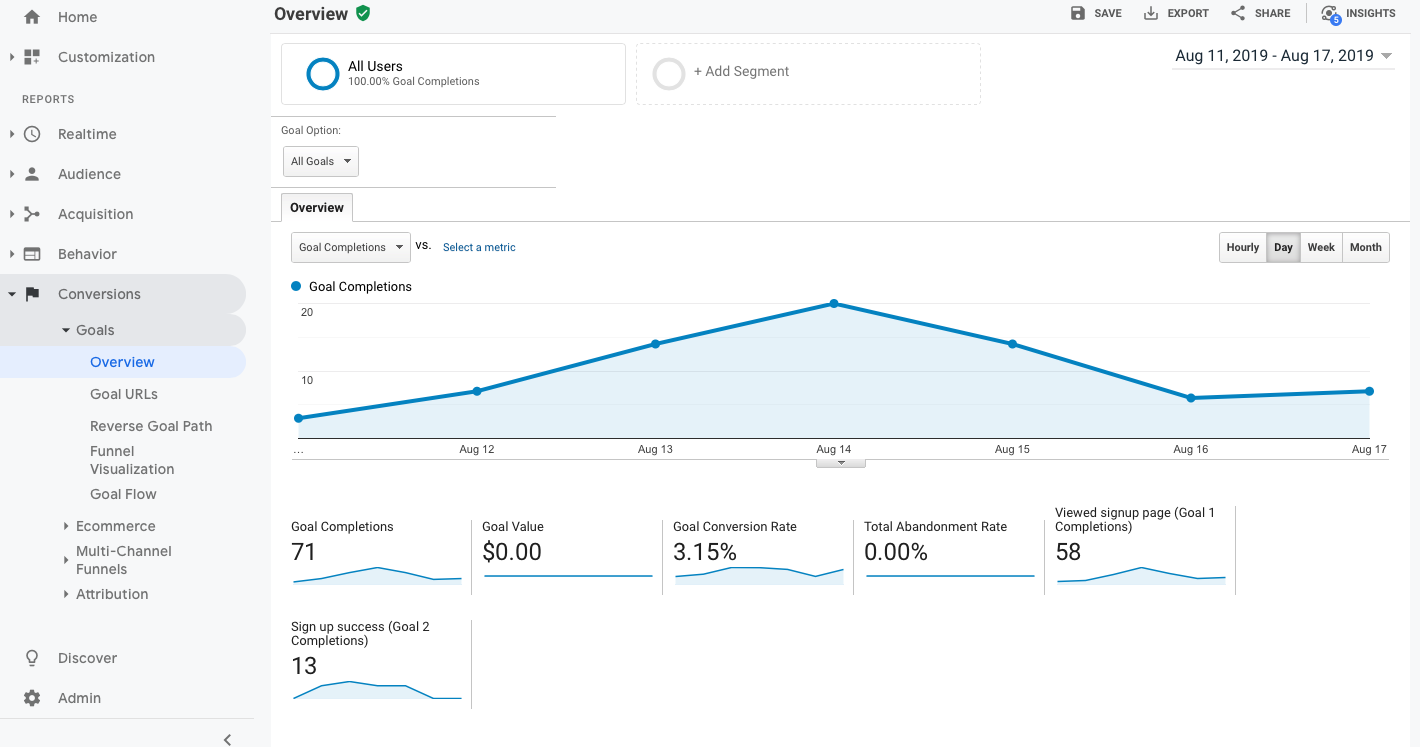
For non-eCommerce companies, conversions can be useful for seeing things like signups and newsletter subscriptions, but these can largely be visualized more easily via Behavior/Events. The Conversions report shines for eCommerce companies because it lets you break down your revenue and analyze the journey behind it.
Google also offers a dedicated subcategory for eCommerce, to break down performance product by product and analyze how your shop is performing on the whole. We won’t spend more time digging into Conversions because it’s so situational, but it’s worth spending time on if you run an eCommerce website.
—
And there you have it! Hopefully this guide was useful in giving you an overview for the different reports.
To simplify it, for most small businesses, the majority of what you need can be found between the audience and acquisition tabs – they’ll tell you how many people are visiting your website, and where they’re coming from.
Once you start getting real traffic, behavior is the next place to go to figure out what they’re doing once they get there, so you can optimize.
And, that’s it – good luck tracking!
What questions do you have about Google Analytics? How can I help make it easy for you? Message me through the contact page or DM me on Instagram.
 Welcome! My name is Glenneth and I live in beautiful East Tennessee. I wear many hats: CEO of The Visibility Method, SEO & Google Ads Expert, content creator, and more. I love technology, social media, and weight lifting. My favorite place to hang out is the hammock in my backyard. My favorite colors are pink and orange. My favorite team is the Vols. And I LOVE to get email so please drop me a note and say hi!


A great explanation thank you! I am not the best w my GA