Having switched from Universal Analytics (GA3) to Google Analytics 4 (GA4), you might be wondering what the metrics are you should be reviewing now and more importantly WHERE are they located.
We will be looking at a few different data metrics in GA4, but before we jump into that, let’s talk about why checking your website data is so important for your business.

Checking your website analytics (I highly recommend using Google Analytics for any website platform you use) is important because it’s going to help you best understand who is visiting your website, how to enhance their user experience, and what content you actually should be focusing on. In addition, it’s important for improving your SEO because you will be able to better target the people who are already organically searching for what your business has to offer.
If you’re not checking your analytics on a regular basis (I recommend doing this about once a month to truly get an understanding of your traffic and audience), you’re missing out on getting visible with the people who are looking specifically for your product or service.
Let's go:
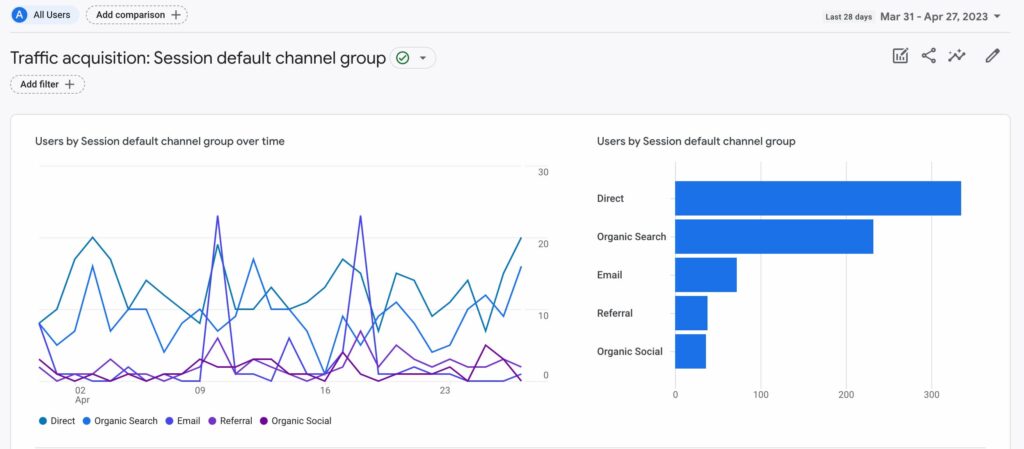
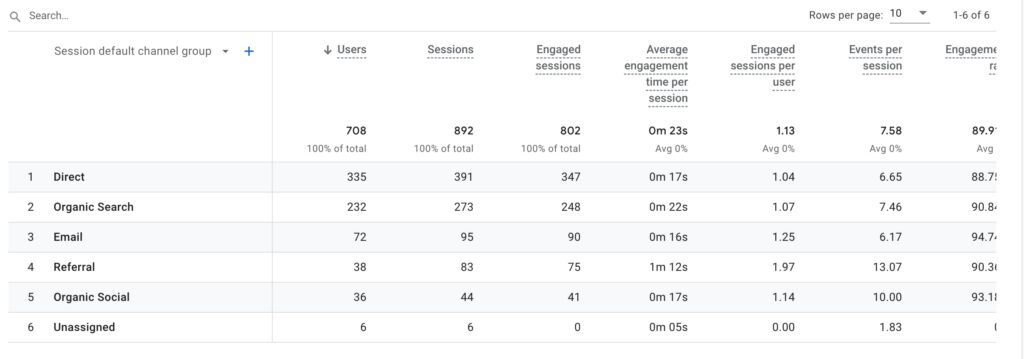
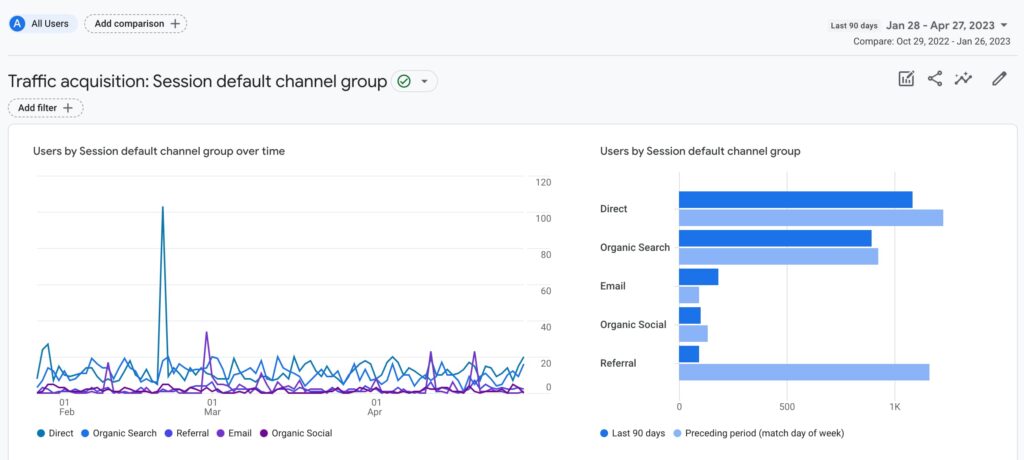
PATH IN GA4: Reports / Lifecycle / Acquisition / Traffic Acquisition
Do you know where your traffic is coming from? Are people finding you organically? Are they clicking on your site through social media? Are they coming to you directly? This will help you know what content is working and what isn’t working.
PATH IN GA4: Reports / Lifecycle / Engagement / Pages and Screens
By reviewing your most popular pages, you’ll have a better idea of what content is actually resonating with your audience. You can then use this information to create more content specific to that area of interest.
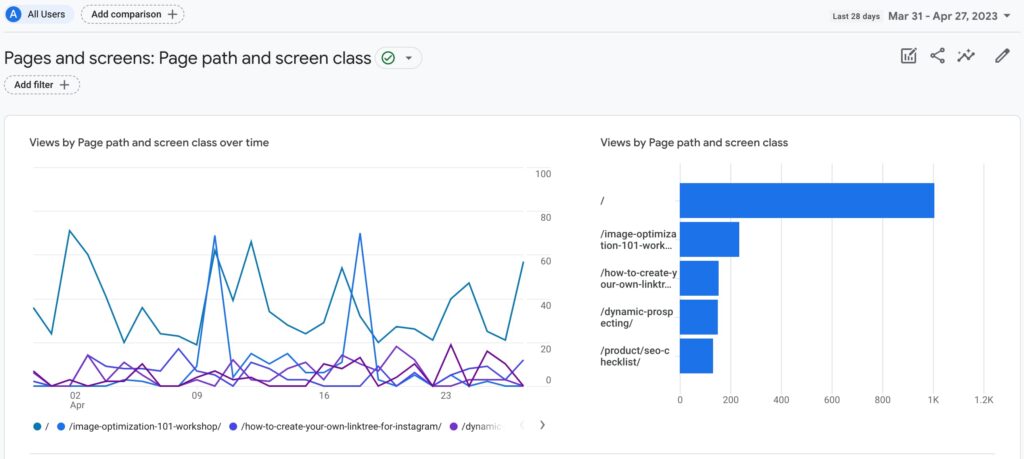
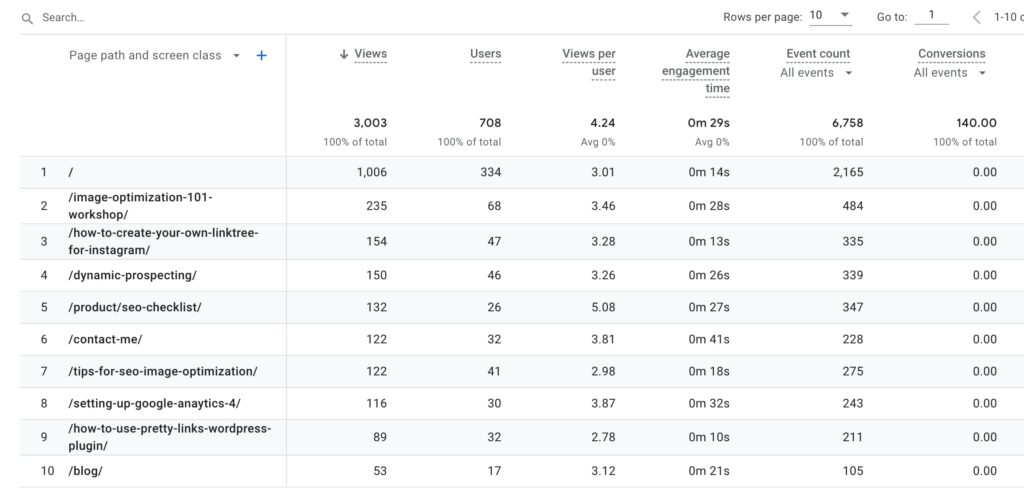
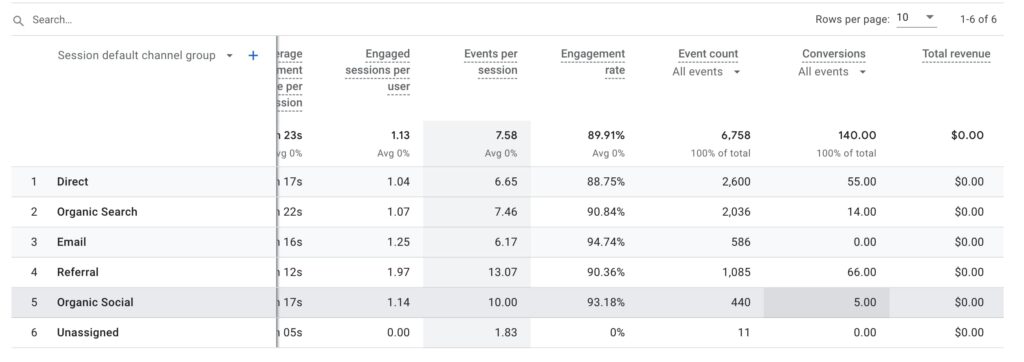
We’re going to look at different data points on the two above reports.
Traffic Acquisition:
Engaged Sessions: In Universal Analytics, you reviewed bounce rate, in GA4, you want to look at engaged sessions. This is the number of sessions that lasted longer than 10 seconds, or had a conversion event, or had 2 or more screen or page views.
Average Engagement Time Per Session: User engagement duration per session.
Conversions: The number of times users triggered a conversion event.
Pages and Screens:
Average Engagement Time: This is the average length of time that the website had focus in the browser.
Views per user: The average number of web pages viewed per user.
PATH IN GA4: Reports / User / Demographics / Demographic Details
This is another way for you to see where the traffic on your website is coming from. What regions, states, or countries are driving the most traffic to your site.
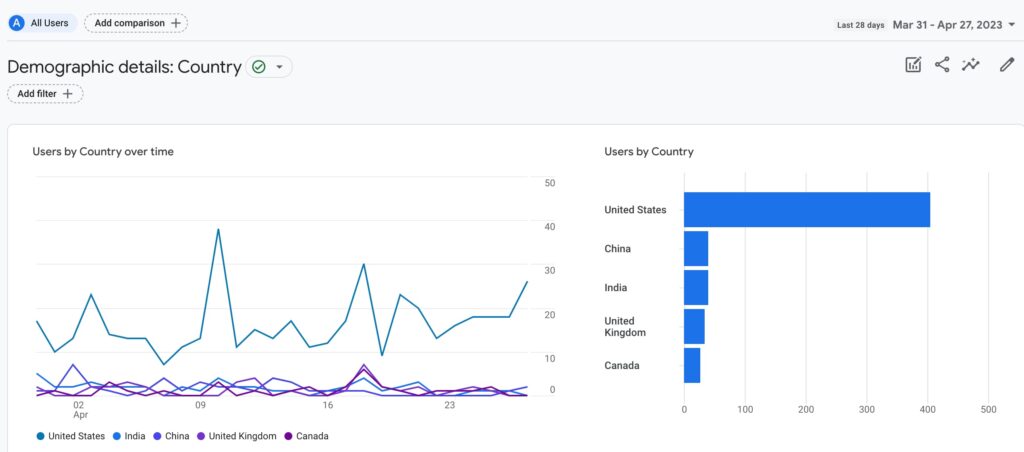
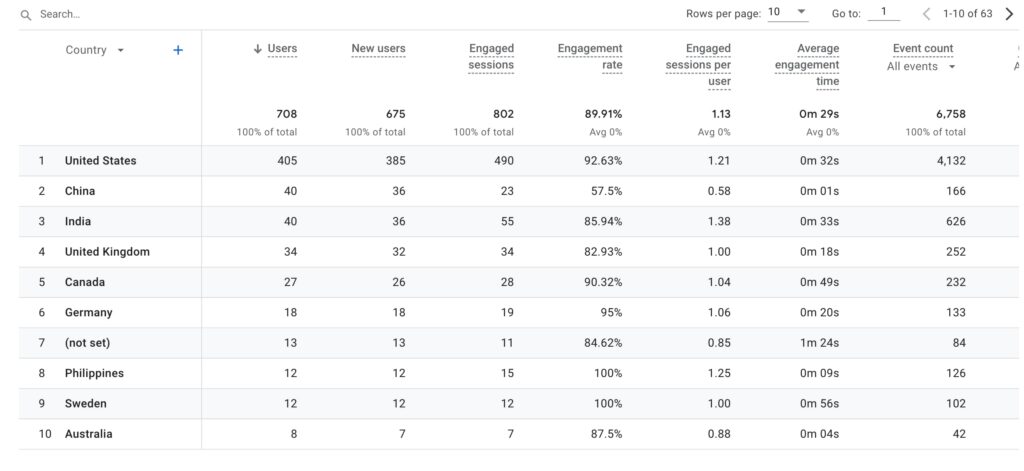
You can compare time periods to see how your traffic is doing. I recommend comparing 3 or 6 months with the previous 3 or 6 months and then compare 3 or 6 months with the same months as the previous year. Look at the trend of website traffic over several months or years to see how your traffic is trending and to make adjustments as you go. This is the traffic acquisition report above.
Note: Depending on when you installed Analytics, you may or may not have enough data for this comparison.
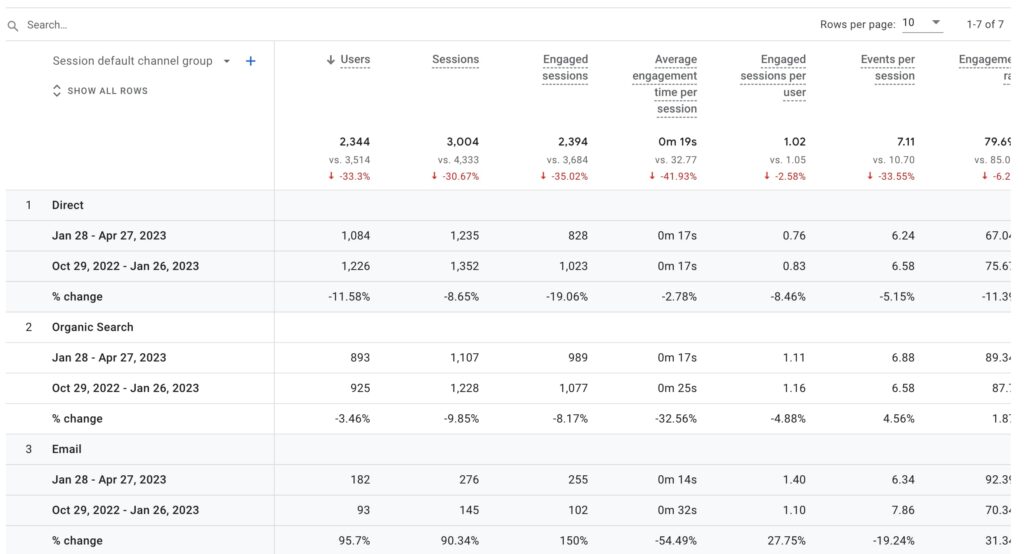
Google Analytics 4 (GA4) is new to all of us and there is definitely going to be a learning curve. But don't let this stop you from reviewing your metrics on a regular basis so that you can know which of your marketing efforts are working.
Questions about GA4? Use the contact form to leave me a message.
 Welcome! My name is Glenneth and I live in beautiful East Tennessee. I wear many hats: CEO of The Visibility Method, SEO & Google Ads Expert, content creator, and more. I love technology, social media, and weight lifting. My favorite place to hang out is the hammock in my backyard. My favorite colors are pink and orange. My favorite team is the Vols. And I LOVE to get email so please drop me a note and say hi!