To install the custom Google Analytics dashboard you need to be signed into the Gmail address that you used for Analytics AND have Google Analytics open in another tab. Click on this link:
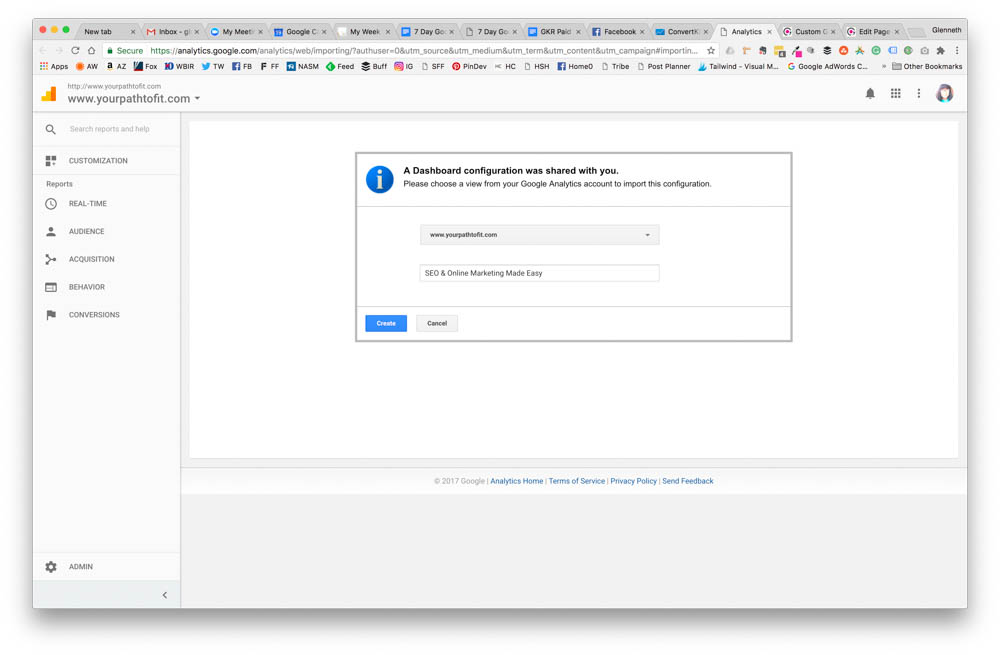
You will see the following in your Google Analytics tab:
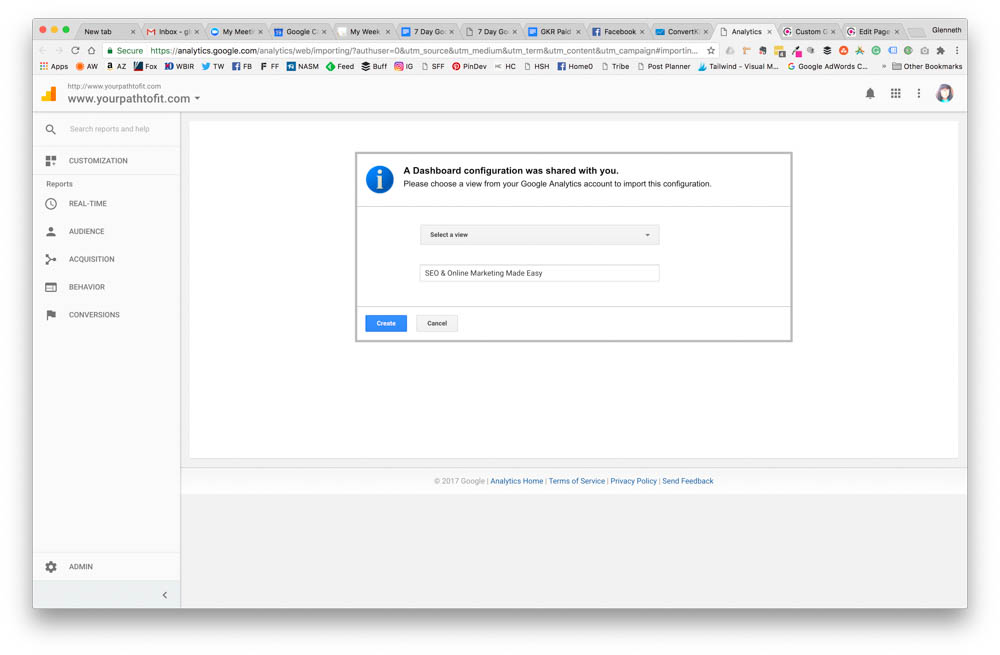
For select a view, choose the dropdown and select your URL then hit CREATE.
Now that you have the custom Google Analytics Dashboard installed (it should look like below except with data from your site), what does it all mean and why did I choose these metrics? Note: If you just installed Analytics yesterday – you will have little to no data in your dashboard.
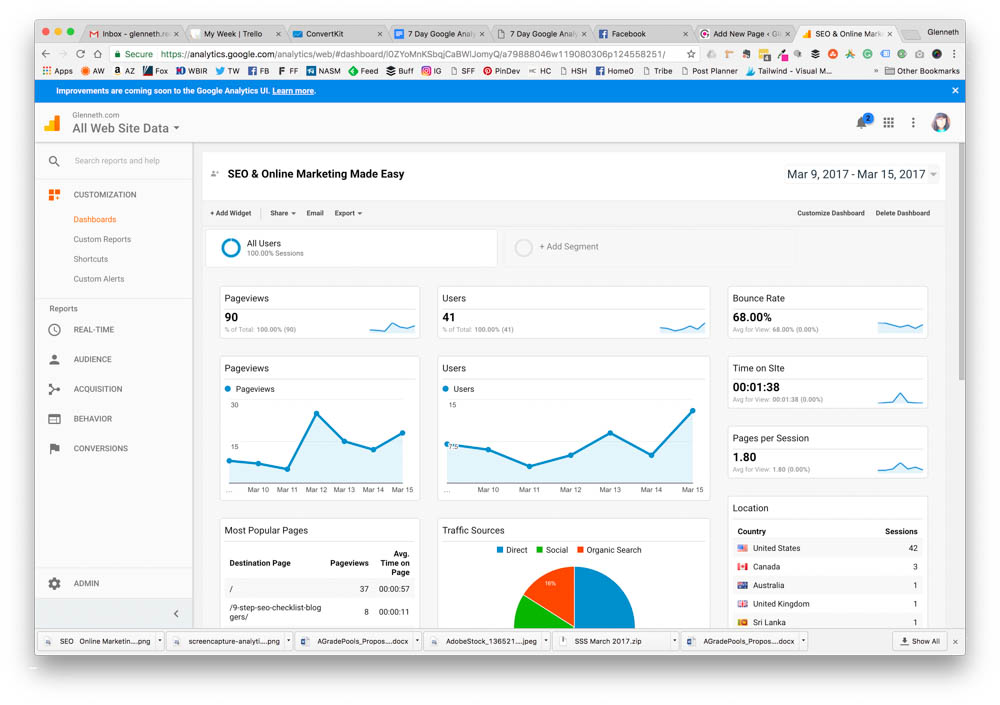
Pageviews
The total number of pages viewed. Almost all brands and sponsors will ask your number of pageviews. Do be careful though as analytics has started showing only the past 7 days. Make sure to set to 30 days for monthly data.
Users
The number of unique visitors on your site (will almost always be less than pageviews because many users view multiple pages). This tells you how many people are finding you each month.
Bounce Rate
When someone comes on your site, views the page they landed on and then leaves, that is referred to as a bounce.
Per Google: “Bounce rate is single-page sessions divided by all sessions, or the percentage of all sessions on your site in which users viewed only a single page and triggered only a single request to the Analytics server.”
Bloggers typically have higher bounce rates than sites such as retail, restaurants, service providers, etc.; because the majority of people read an article and leave. This number is good to know, but don’t dwell on it. In order to decrease bounce rate and have users spend more time on site and see more pages, you can link internally and suggest other pages that might be of interest to them based on the post they are reading.
Time on Site
The average time a visitor spends on your site. Again, good to know, but don’t dwell on the number.
Pages Per Session
The average number of pages viewed per session. You want users to view more than one page, so knowing this number can help you to improve it.
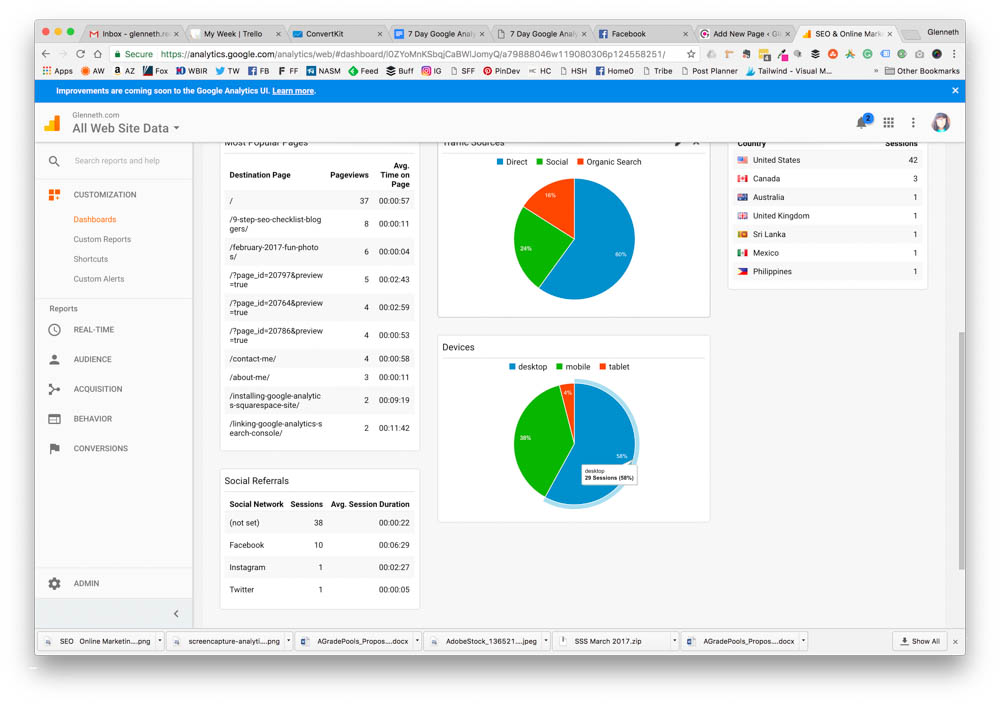
Most Popular Pages
Your most popular pages for the specified date range. (We will cover this more in depth tomorrow.)
Traffic Sources
How the user made it to your site:
Location
The country where your visitors are coming from. Within Analytics, you can even drill down to see the most popular states and cities. This is another good to know metric and brands/sponsors may ask.
Social Referrals
Which social networks are sending the most traffic to your site. If one social network is sending most of the traffic, are you using that network to its fullest potential?
Devices
The type of device your visitors are using. More and more are coming from mobile – is your site mobile optimized? This is key and Google is really cracking down on sites that are not mobile-optimize/mobile friendly.
